• Transforming Quantity Surveying with AI: A Journey to Precision

    Introduction

    In the realm of construction, the precision of cost management and economic efficiency directly influences the success of a project. At the heart of achieving this precision lies the expertise of the quantity surveyor, professionals dedicated to ensuring that projects are completed within budget and according to financial forecasts. A cornerstone of their work involves generating detailed cost plans that adhere to industry standards, one example would be the Australian Institute of Quantity Surveyors (AIQS). Their guideline splits costs into elemental classifications, providing a structured approach to estimating, controlling project expenses, and sets up a base line for cost plans A to C.

    This article explores and reiterates the initial extraction of data from my cost plans to employing advanced artificial intelligence (AI) models, culminating in achieving an impressive accuracy rate when it comes to elemental coding of cost plans under the research projects that i have been tasked on. It aims to unfold the layers of AIQS elemental classification and its practical application in the day-to-day profession of a quantity surveyor, enhancing the accuracy and efficiency of cost plans. So that in future we don’t have to tag descriptions with elemental coding’s.

        # Simple Flat Dictionary for Tagging
    CODING_ELEMENTAL_AIQS = {
        "PR": "Preliminaries",
        "SB": "Substructure",
        "CL": "Columns",
        "UF": "Upper Floors",
        "SC": "Staircases",
        "RF": "Roof",
        "EW": "External Walls",
        "WW": "Windows",
        "ED": "External Doors",
        "NW": "Internal Walls",
        "NS": "Internal Screens & Borrowed Lights",
        "ND": "Internal Doors",
        "WF": "Wall Finishes",
        "FF": "Floor Finishes",
        "CF": "Ceiling Finishes",
        "FT": "Fitments",
        "SE": "Special Equipment",
        "SF": "Sanitary Fixtures",
        "PD": "Sanitary Plumbing",
        "ME": "Mechanical Services",
        "WS": "Water Supply",
        "GS": "Gas Services",
        "SH": "Space Heating",
        "VE": "Ventilation",
        "EC": "Evaporative Cooling",
        "AC": "Air Conditioning",
        "CE": "Centralised Energy Systems",
        "FP": "Fire Protection",
        "LP": "Electric Light & Power",
        "CM": "Communications",
        "TS": "Transportation Systems",
        "SS": "Special Services",
        "AR": "Alterations & Renovations",
        "XP": "Site Preparation",
        "XR": "Roads, Footpaths & Paved Areas",
        "XN": "Boundary Walls, Fencing & Gates",
        "XB": "Outbuildings & Covered Ways",
        "XL": "Landscaping & Improvements",
        "XK": "External Stormwater Drainage",
        "XD": "External Sewer Drainage",
        "XW": "External Water Supply",
        "XG": "External Gas",
        "XF": "External Fire Protection",
        "XE": "External Electric Light & Power",
        "XC": "External Communications",
        "XS": "External Special Services",
        "XX": "External Alterations & Renovations",
        "YY": "Special Provisions",
        "ET": "Escalation to Tender",
        # Add any additional codes as needed
    }

    Data Extraction and Preparation

    The journey commenced with the extraction of meaningful data from previous cost plans that i worked on CostX software, renowned for its elemental and trade coding capabilities. Following the extraction, the data were exported to Excel for preliminary analysis, setting the stage for a crucial clean-up phase where I had to go in and clean up all unnecessary parts of the dataset.

    A custom Python script was developed to refine the exported data. The clean-up process involved removing empty rows, discarding non-numerical quantity and rate values, and ensuring the presence of a description and elemental code for each entry. This meticulous data preparation was foundational, ensuring the integrity and usefulness of the data for training AI models. The script served not just as a filter but as a bridge between raw data and a structured dataset ready for advanced analysis.

    import subprocess
    import os
    import pandas as pd
    
    def convert_xlsx_to_csv_with_xlsx2csv(directory):
        for filename in os.listdir(directory):
            if filename.endswith('.xlsX'):
                file_path = os.path.join(directory, filename)
                csv_path = file_path.rsplit('.', 1)[0] + '.csv'
                try:
                    subprocess.run(['xlsx2csv', file_path, csv_path], check=True)
                    print(f"Converted {file_path} to {csv_path}")
                except subprocess.CalledProcessError as e:
                    print(f"Failed to convert {file_path}: {e}")
    
    def clean_csv_files(directory):
        """Clean all CSV files in the directory."""
        print(f"Cleaning CSV files in directory: {directory}.")
        for filename in os.listdir(directory):
            if filename.endswith('.csv'):
                csv_path = os.path.join(directory, filename)
                print(f"Cleaning data in {csv_path}")
    
    ******************************************
      column_names = ['Code', 'Description', 'Quantity', 'UOM', 'Rate', 'SubTotal', 'Factor', 'Total', 'Total', 'Building Name', 'Workbook Name']
                df.columns = column_names  # Assign column names
                # Convert 'SubTotal' column to numeric
                df['SubTotal'] = pd.to_numeric(df['SubTotal'], errors='coerce')
                # Remove rows where SubTotal column value is not bigger than 1
                df = df[df['SubTotal'] > 1]
                df = df.dropna(how='all')  # Delete rows that do not contain any information   
                # Save the cleaned data back to CSV
                df.to_csv(csv_path, index=False)
                print(f"Cleaned data saved to CSV: {csv_path}")
    
    def main(directory):
        convert_xlsx_to_csv_with_xlsx2csv(directory)
        clean_csv_files(directory)
    
    if __name__ == "__main__":
        directory = os.path.dirname(os.path.realpath(__file__))
        main(directory)

    From Simple Models to NLP

    The initial foray into AI involved simple models that laid the groundwork for understanding how AI could be leveraged in quantity surveying. However, the quest for higher accuracy and more nuanced data interpretation led to the exploration of Natural Language Processing (NLP) and BERT models. As a non-profesional on data science, it is quite impressive to see these potentials even with a small sample data. This transition marked a significant evolution in the approach to analysing cost plan data, moving from basic predictive models to sophisticated algorithms capable of understanding and processing language-based data.

    Employing NLP and BERT models allowed for a deeper dive into the textual data within cost plans, enabling the extraction of more detailed insights and improving the accuracy of cost estimations. This shift underscored the importance of adopting advanced AI technologies to stay at the forefront of the quantity surveying field, ensuring that cost plans are not only accurate but also rich in detail and analysis.

    # Simple learning using sklearn libraries
    import pandas as pd
    from sklearn.feature_extraction.text import TfidfVectorizer
    from sklearn.svm import LinearSVC
    from sklearn.pipeline import make_pipeline
    from sklearn.model_selection import train_test_split, GridSearchCV
    from sklearn.metrics import classification_report
    
    # Function to train a more complex AI model for text classification
    def train_ai_model(csv_file_name):
        # Load the dataset
        data = pd.read_csv(csv_file_name)
    
        # Split the data into training and testing sets
        X_train, X_test, y_train, y_test = train_test_split(
            data['Description'], 
            data['Code'], 
            test_size=0.2, 
            random_state=42
        )
    
        # Create a pipeline with TfidfVectorizer and LinearSVC
        model = make_pipeline(TfidfVectorizer(max_features=5000), LinearSVC(class_weight='balanced'))
    
        # Define a parameter grid to search for the best hyperparameters
        param_grid = {
            'tfidfvectorizer__ngram_range': [(1, 1), (1, 2)],
            'linearsvc__C': [0.1, 1, 10]
        }
    
        # Perform grid search
        grid_search = GridSearchCV(model, param_grid, cv=5, scoring='accuracy')
        grid_search.fit(X_train, y_train)
    
        # Best model after grid search
        best_model = grid_search.best_estimator_
    
        # Predict on the testing set
        y_pred = best_model.predict(X_test)
    
        # Evaluate the model
        print(classification_report(y_test, y_pred))
    
        # Return the best model
        return best_model
    
    # Function call
    model = train_ai_model('00combined_cleaned_data_trainingset.csv')
    

    Optimization with Optuna

    After playing around with a few model trainers, I realised that there are heaps of parameters that can affect the quality of the prediction performance. That’s why I ended up with automating the process of fine tuning with Optuma, so that it would find the sweetspot by recursive iterations. The optimization of the learning algorithms was facilitated by Optuna, a hyperparameter optimization framework. Optuna was instrumental in fine-tuning the model parameters, such as the learning rate and batch sizes, to achieve optimal performance. Through an iterative process as mentioned earlier, Optuna evaluated various combinations of parameters, guiding the adjustment of the models for better accuracy and efficiency.

    This optimization process was critical in enhancing the model’s performance, pushing the accuracy rate to new heights. The use of Optuna highlighted the importance of not just selecting the right models but also fine-tuning them to fit the specific nuances of the cost plan data, ensuring that the AI models were fully optimized for the task at hand.

    Achieving High Accuracy

    The pinnacle of this journey was reaching an accuracy rate of 94% with the AI models, a significant achievement that underscored the success of the meticulous data preparation and optimization efforts. Also its worth mentining that upon reviewing the dataset, I realised as a human even my ability to put elemental codes on certain items are situation, and cant tag certain descriptions purely by looking into the description itself since a masonry wall can be both external or internal walls. Therefore It was quite satisfactory for an ai model to reach 94% accuracy on this task even with using an 80% to 20% conservative ratio for training and validation, respectively. This approach ensured that the model was trained on a comprehensive dataset while still having a robust set for validation and testing.

    The training process was rigorous, involving night-long training sessions to fine-tune the models and optimize their learning rates and batch sizes. It’s surprising that this workflow is actually very similar to those Vray Nightlong renders when I was doing in my architecture career back in the graduate years of my life. So my dedication to refining the AI models paid off, as evidenced by the high accuracy rate, showcasing the potential of AI in transforming the field of quantity surveying and setting a new standard for cost plan accuracy.

                   precision    recall  f1-score   support
        accuracy                           0.93      3116
       macro avg       0.89      0.90      0.89      3116
    weighted avg       0.93      0.93      0.93      3116
    

    Case Study: Implementing AIQS Classification

    The practical application of the refined AI models to real-world cost plans can bring the theoretical aspects of this journey into reality. Implementing the AIQS elemental classification using the AI models can streamline the process of generating cost plans, significantly improving the workflow and accuracy of cost estimations in future. Hope CostX can implement such feature in future and provide some extension or addin library for professionals working in the field to make their life easier. In my research, we demonstrated the tangible benefits of integrating AI into quantity surveying, including increased efficiency, reduced errors, and a deeper analytical insight into cost elements.

    The successful integration of AIQS elemental classification through AI models signifies a leap forward for the profession, offering a glimpse into the future of quantity surveying where AI plays a central role in enhancing the accuracy and efficiency of cost planning.
    by

  • CostX – Scripts to Help Aid Manual Routines

    Reflecting on the past year, my journey with Autohotkey Script has been one of continuous innovation, particularly in enhancing multi-user support, licensing systems, and integrating regular reports on Earned Value Management (EVM). Initially, my focus was on modifying the script for better accessibility across different user setups, especially for CostX applications. This led to the adoption of native sequenced keyboard entries, significantly improving script reliability and user experience.

    Moreover, I delved into custom functionalities tailored to the daily workflows of quantity surveyors and cost planners. Recognizing the tedious process involved in zone adjustments for dimension groups, I implemented a feature simplifying this task, making it as straightforward as a control + right click. Similar enhancements were made to adjust the heights of dimension groups effortlessly, catering to the specific needs of measuring windows or curtain walls.

    Additionally, I introduced a shortcut for adding structural steel dimension groups, streamlining the selection of characteristics like weight, color differentiation, and the application of steel weight constants through an intuitive interface. While further optimization is ongoing, these developments have significantly eased the previously cumbersome processes.

    #If (WinActive("ahk_class RAIL_WINDOW") || WinActive("ahk_exe CostX.exe"))
    ^F5:: ;WELL ADD Dimension group button : precious steel dim
    Send <!dmgaa
    Send ^v
    Send {Tab 2}
    Send {L}
    Send {Tab 1}
    SendRaw {We}
    Send {Tab 5}
    Gosub RandomColor
    Send, % costXColours[i]
    ...

    Looking ahead, we’re not just stopping at functional enhancements. Our roadmap includes advancing licensing, security measures, and establishing trust with antivirus databases. Moreover, we’re simplifying the digital distribution of our script, offering it at the nominal cost of a coffee for a six-month license. This journey underscores our commitment to not only enhancing productivity but also ensuring our solutions are accessible, secure, and continuously evolving to meet the dynamic needs of our users.

    by

  • A Short Walk About Tender Evaluation

    Tender evaluation in quantity surveying is a critical process that ensures construction projects are awarded to the most suitable contractors based on a comprehensive analysis of several factors. In Victoria, with its unique market conditions and regulatory environment, understanding the nuances of tender evaluation can significantly impact the success of any project. With this guide we aimed to provide a concise overview of the tender evaluation process, focusing on key aspects specific to Melbourne’s construction landscape from a third party consultant’s point of view in particular Quantity Surveyor’s.

    Preparing for Tender Evaluation

    Before the evaluation begins, it’s essential to establish clear criteria based on the project’s objectives, budget, and timeline. Normally with a high chance, as a Quantity Surveyor on the job, we would provide clients with at least a Pre-Tender Estimate (CP-E) if not a Bill of Quantity. It’s also important that project’s objectives, documented building works, and other project particulars should align with the building standards and local construction regulations. While noting that it should, sole responsibility also does not fall to QS since we are not professionals on building regulations however it actually benefits all parties when we mindfully review say if we need an wet fire protection system ? Do we need fire tanks ? Are then still ambiguous points when it comes to substructure scope of works ? Did the structural engineer fully clarified and responded the Geo-technical report? Preparation involves:

    1. Defining Scope: Detailing the project’s requirements, including materials, labor, and technical specifications.
    2. Market Analysis: Understanding current market trends in Melbourne to set realistic budgets and timelines. Following a close review of the market provides exceptional benefits to the project managers since bringing clarity into the cost plans is the prime directive. Imagine where someone placing 25$/m3 for a bulk excavation where in the height of all ongoing infrastructure projects finding an excavator actually impacted the industry. On top of the affects of covid / interest rates and other industrial relations issues like access to labour can cause dramatic budget blow outs on certain trades.
    3. Compliance Checks: Ensuring all tenders adhere to Melbourne’s building codes and environmental regulations.

    Evaluation Criteria

    A robust tender evaluation process in Melbourne considers several key factors beyond the initial cost. These include:

    • Price: Price of each and every trade line item in the tender should be clearly identifiable. Practically most project tenders would require a trade based breakdown that at lease splits the project into over 30-40 different cost items. Tender price submission also traditionally follow the prepared Pre-Tender Cost Plan or the Bill of Quantity so that it would provide a baseline for an apples to apples comparison.
    • Experience: Contractors’ track record with similar projects in Melbourne’s construction environment.
    • Capacity: Assessment of labor, equipment, and financial stability to meet project demands.
    • Sustainability: Consideration of environmentally friendly practices and materials. If possible is there a Carbon Embodiment Report available?
    • Inclusions & Exclusions : We all know that no matter how many tenders we set up, most submissions will differ based on the long list of inclusions & exclusions that each contractor specifies. The only way to bring them back to same page is to implement an inclusions – exclusions impact comparison. So that we can identify why certain inclusions, and exclusions cause the identified affects, and does those items actually make sense?
    • Local Impact: Evaluation of the tender’s contribution to the local economy and community.

    The Evaluation Process

    The tender evaluation process in Melbourne typically follows these steps:

    1. Tender Receipt: Collection and logging of all tender submissions within a deadline is imperative so that all parties would adhere to the time-bars to keep the workflows stable.
    2. Initial Screening: Removing tenders that fail to meet the basic requirements or compliance standards.
    3. Detailed Evaluation: A comprehensive review based on the predefined criteria. In this step the Quantity Surveyor generally comes back with a large table that would compare last prepared cost plan, and all submissions along with comments as per each trade code, each inclusion & exclusion, and other factors that effect the cost. It is also important and I always do the exercise to go and compare all contract conditions of the submissions, as well as the subcontractor comparison since some builders actually use the same subcontractor, if that is the case it would also make sense to see similar numbers in the submissions.
    4. Interviews and Clarifications: Engaging shortlisted contractors for further discussions or to clarify proposals. It is recommended to keep these to one single meeting rather than a recursive series of meetings & clarifications since a well documented work flow would not need that level of physical meetings & interactions.
    5. Final Decision: Based on the evaluation, the best-suited contractor is selected and awarded by the Project Manager, taking into account all factors after receiving the final report from the QS. Since Quantity Surveyors generally in this context if hired to provide opinion and reports to the Project Manager or the acting Superintendent.

    by

  • AHK (autohotkey) Scripting for CostX

    AHK (autohotkey) Scripting for CostX

    Hello everyone,

    It’s been a bit since I last shared an update. I’ve been deeply engrossed in my Excel tables and estimations for about the last 9 months. However, I’ve developed some strategies that have significantly streamlined my workflow, and I believe they could be beneficial for others as well.

    First off, I want to express my gratitude to everyone who nudged me towards this Autohotkey journey, from the IT team to my directors, and all who shared their insights. It seems it’s finally time to reap the benefits. In a subsequent post, I’ll delve into Jim Deng’s method, which utilizes Razer Tartarus Keypads and Razer’s native macro software instead of Autohotkey and scripts. I’ll compare the two approaches in a future entry.

    The following guidelines are for those who, like me, start their day with CostX at 9:00 am on weekdays, aiming to prevent repetitive strain injury (RSI) and to spare extra time for that additional cup of coffee or a moment in the sunshine for some vitamin D generation.

    Let’s dive in. We’ll begin by configuring shortcut keys in our trusted CostX software as follows:

    image

    Alt + 1 > Undo,

    Alt + 2 > Redo, Alt + 3 > Add Dimension Group,

    Alt + 4 > Drawing Properties,

    Alt + 5 > Dimension Properties,

    Alt + 6 > Zoom Extents,

    Alt + 7/8 > Line/Point Mode

    image

    Next, visit https://www.autohotkey.com/ and download the software.

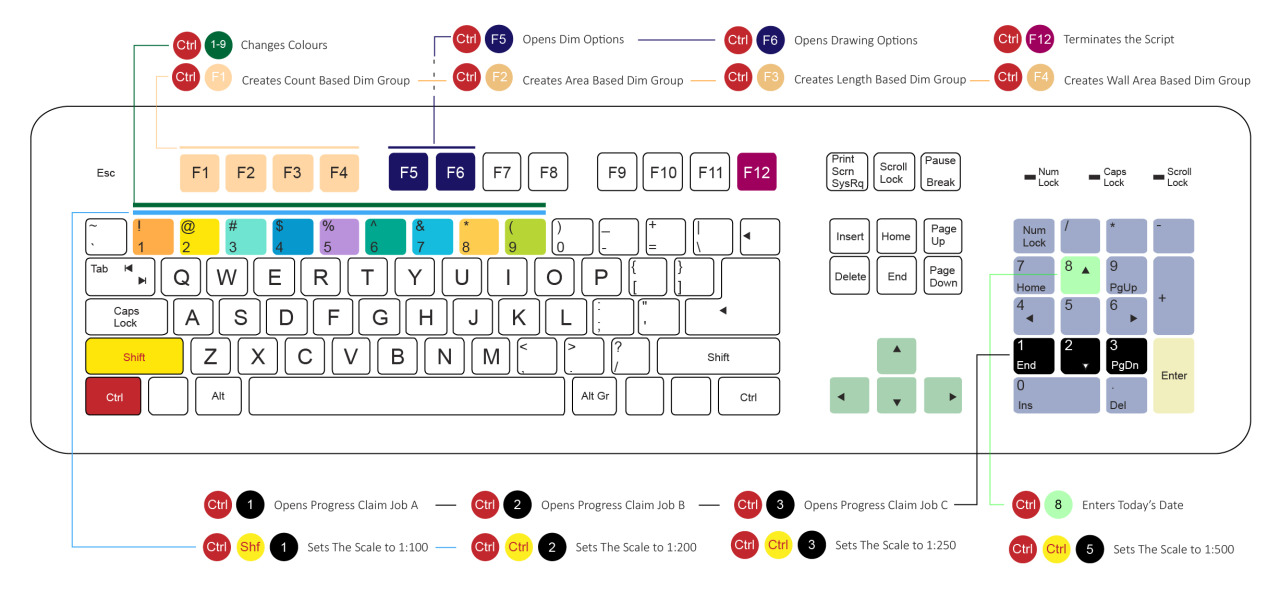
    Before we get into the script, let’s address a key feature: assigning random colors to dimension groups. This practice aids the reviewer by distinguishing each dimension group with unique colors, making it easier to understand the estimation at a glance. Without varied colors, it becomes challenging to discern which dimensions cover specific plan areas.

    To address this, I’ve devised a color array in the script:

    RandomColor:

    Colours := [“Bottle”,“Orange”,“Aqua”,“Dogg”,“Mediterranean Blue”,“Purple”,“Tan”,“Choc”,“Blue”]

    CostXColours := [“Chocolate”,“Tan”,“Orange”,“Goldenrod”,“Gold”,“Sand”,“Olive”,“Avocado”,“Bottle Green”,“Green”,“Lawn Green”,“Grass Green”,“Lime”,“Light Green”,“Spearmint”,“Aqua”,“Teal”,“Mediterranean Blue”,“Sky Blue”,“Dodger Blue”,“Battleship”,“Navy”,“Dark Blue”,“Royal Blue”,“Cadet Blue”,“Blue”,“Dark Purple”,“Purple”,“Lavender”,“Lilac”]

    random, i, 1, % CostXColours.count()

    random, v, 1, % Colours.count()

    Return

    This array includes a wide range of colors available in CostX.

    Here’s a snippet to automate dimension grouping with a random color assignment:

    #IfWinActive, ahk_class RAIL_WINDOW
    ^F1:: ; Assigns the 'Add Dimension Group' button to Quick Cast on the top menu, working with Ctrl+3 for Area
    Send <!3
    Send ^v
    Send {Tab 2}
    Send {C}
    Send {Tab 6}
    Gosub RandomColor
    Send, % CostXColors[i]
    Send {Tab 13}
    Send {End}
    Return

    Pressing Ctrl+F1 triggers the above script, automating several steps in CostX with the defined shortcuts and randomly assigned colors.

    Now, let’s set up our progress claim job folders for easy access via Numpad shortcuts. Edit the Autohotkey script to include the following code, adjusting the folder path as needed:

    ; Dennis's Numpad Shortcuts
    ^Numpad1:: ; OPENS MY PROGRESS CLAIMS 1 FOLDER
    Run, U:\documents\2017\Project A
    WinActivate
    WinMaximize
    Return

    Cheers,

    Happy estimating, everyone! Now, you can fully leverage CostX.

    Please note, if anything goes awry, pressing Ctrl + F12 will terminate the script.

    Best of luck!

    by

  • Epworth Hospital Extension Project | Primavera Schedule Compression Techniques

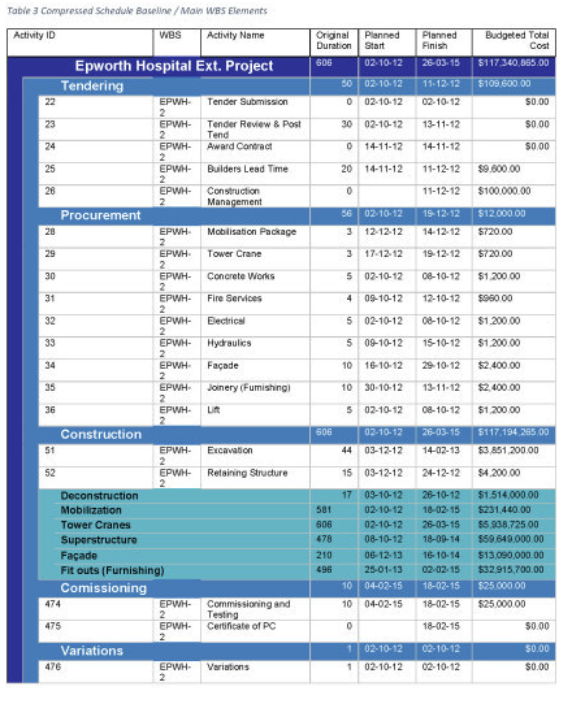
    We have been given the baseline below that represents the tender submission, for the following project. But according to the scenario (term-assignment for one of the subjects @my master’s degree in unimelb) during the post-tender negotiations, the client requested a schedule compression of 20% to meet their business goals.

    After acknowledging the request, schedule compression techniques are investigated to come up with the most beneficial “to-do plan”. Then I fast-tracked some activities as reasonably as possible so that the activity crashing process was implemented on the critical activities.

    image

    Because of the nature of the schedule, it was essential to check the critical path after every crashed activity to see if it relocates itself on the timeline or not. Thus we had to implement an iterative approach. After every iteration of ACR reports, a summary level 4 WBS schedule of the critical path is printed to monitor the process.

    image

    It took six iterations to compress the schedule by 20%. With this dynamic strategy, each ACR report listed all critical activities, based on the expert estimation of additional cost implications, and time savings, via sorting them by their cost slope values. Without such a tool, it would be impossible to engage at this level of precision.

    In conclusion, one of the most punchy features of the Primavera software is custom reports. It would be wise to utilise this function to do repetitive tasks and reports, especially to represent projects on a weekly basis. Fastens workflow, creates a baseline communication, fact based, removes human error. I precisely value the last advantage of it. I imagine myself asking for reports from a project scheduler on a weekly basis, it can easily turn into a life draining tragedy every Friday. People are trying to generate such reports by using complex work flows using different softwares, such as MSP, excel, p6, and other third party softwares in combinations. This renders the process weak against any human error, one might easily skip adding a column before exporting to excel, or can come up with a misleading excel graph. Whereas if you have an automated approach to weekly reports, you would remove all unnecessary risks and become far more efficient than any hardworking bee.

    by

  • Revit Server for Home

    Hello everyone! It’s been some time since I last updated you, as I’ve dedicated the past year to my personal growth. This period allowed me to delve into my readings and confront various software challenges to enhance my skills.

    Around six to seven months ago, I upgraded to a new laptop and repurposed my old one as a makeshift desktop. However, I soon realized my workaround was just to avoid the hassle of connecting and disconnecting my new laptop from my monitor. This prompted me to take action and set up my own server.

    Being an architect with a passion for software, particularly Revit, setting up my own server was something I should have considered much earlier. In past projects, we relied on central Revit files and BIM models. Yet, in Russia, a dedicated Revit Server was never established, and we resorted to a local area network with a file server for storing the central files. Although we faced no significant issues, I was aware that this setup was far from optimal. My attempts to transition to a proper Revit server were unfortunately dismissed based on my manager and the IT department’s advice. They believed that since everything was running on a local network within a single office without issues, there was no need to change.

    For those interested in setting up your own Revit server at home and feeling connected to a team, you’re in the right spot. Here’s how I went about it:

    image

    First, I downloaded Windows Server 2012 for my 64-bit processor-powered laptop. Next, I set my network IPs, gateways, DNS, and subnets considering the router, access point, and unmanaged switch that I use for intranet. This stage took a while to understand, and I even wasted a week on networking 101 tutorials on YouTube. Luckily, a friend, Andrew, helped me out by reminding me to arrange my devices to be in the same subnet, which is one of the most important things to do. Otherwise, you’ll keep encountering Windows authentication asking passwords from Digest. If you get that error and can’t solve it using online guides, don’t worry. Just relax, play with your dog, and ask for help from an IT friend.

    image

    The Revit user application, which runs in workstations connected to the server, can access the Revit Server folder to open projects. This eliminates the need for anyone to manually navigate to a folder using Windows Explorer, reducing the risk of accidentally deleting or moving files. Once the user connects to the server and opens a project, it creates a local copy in the My Documents folder on the workstation. Then, the user only needs to open that file to continue working until syncing with the server to send changes in the file to the server.

    image

    We all know that working in Revit in a single office isn’t ideal unless you have all the subcontractors working in the same office. The most important thing with the Revit Server is that you need a static IP to create connections between offices to work together. IT guys call it WAN, or wide area network. Only then will Revit power the projects to be truly competitive and efficient.

    Thanks for reading, and I hope this helps to find a new angle into your Revit workflows. 

    image

    by

  • Supply Chain Management in Construction

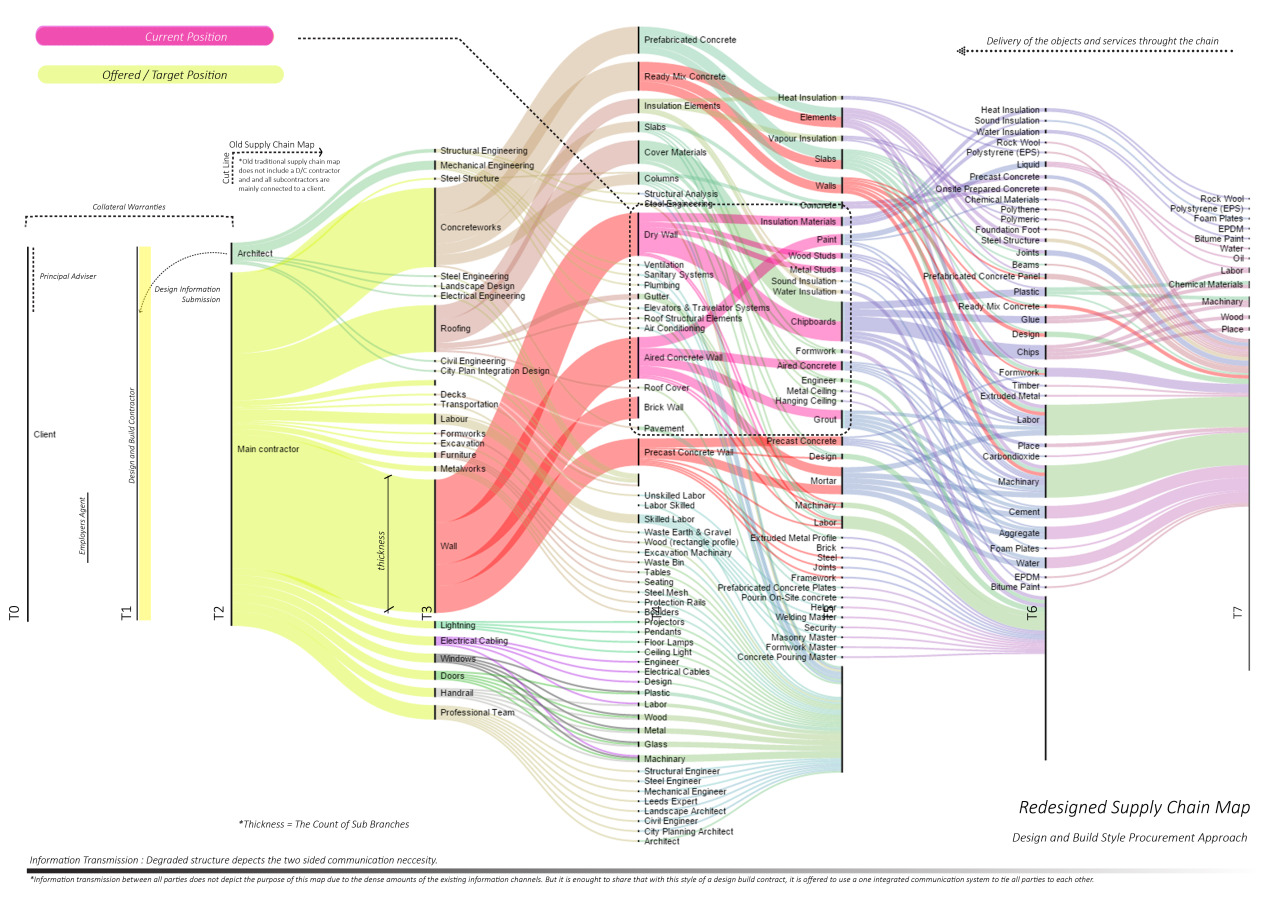
    Alluvial Diagram + hybrid Modifications / “Sankey Diagram”


    During my supply chain management classes, I created a fictional supply chain system for a hypothetical company called “Max Profit Industries” to highlight its complexity and summarize key information for easier focus. Similar to most modern infographics, this map is detailed yet presents a simplified visualization. Thickness indicates the importance of certain branches, while colors designate the roles and tasks of subcontractors. Columns represent the subcontractor tiers, and various symbols are used to depict information flow and item delivery.

    PS: The lecturer referred to the map as a Sankey Diagram, but since I was uncertain about its exact definition, I opted to call it an Alluvial Diagram, as it was labeled in the application I used. However, after making some modifications and enhancements, the map evolved into a hybrid form.

    by

  • MS Project : CMP Timeline

    For my Project Management Theory course, I’ve created a timeline for our assignment, which focuses on a mixed-use zone project featuring hotels, residential apartments, cafes, and landscape design. This was my inaugural experience with Ms Project, and I found the program to be surprisingly intuitive, enabling me to undertake this task. In my opinion, this timeline provides a far more effective summary of the project than the traditional scheduling approach, which required six A0 sheets to visually represent my project.

    by

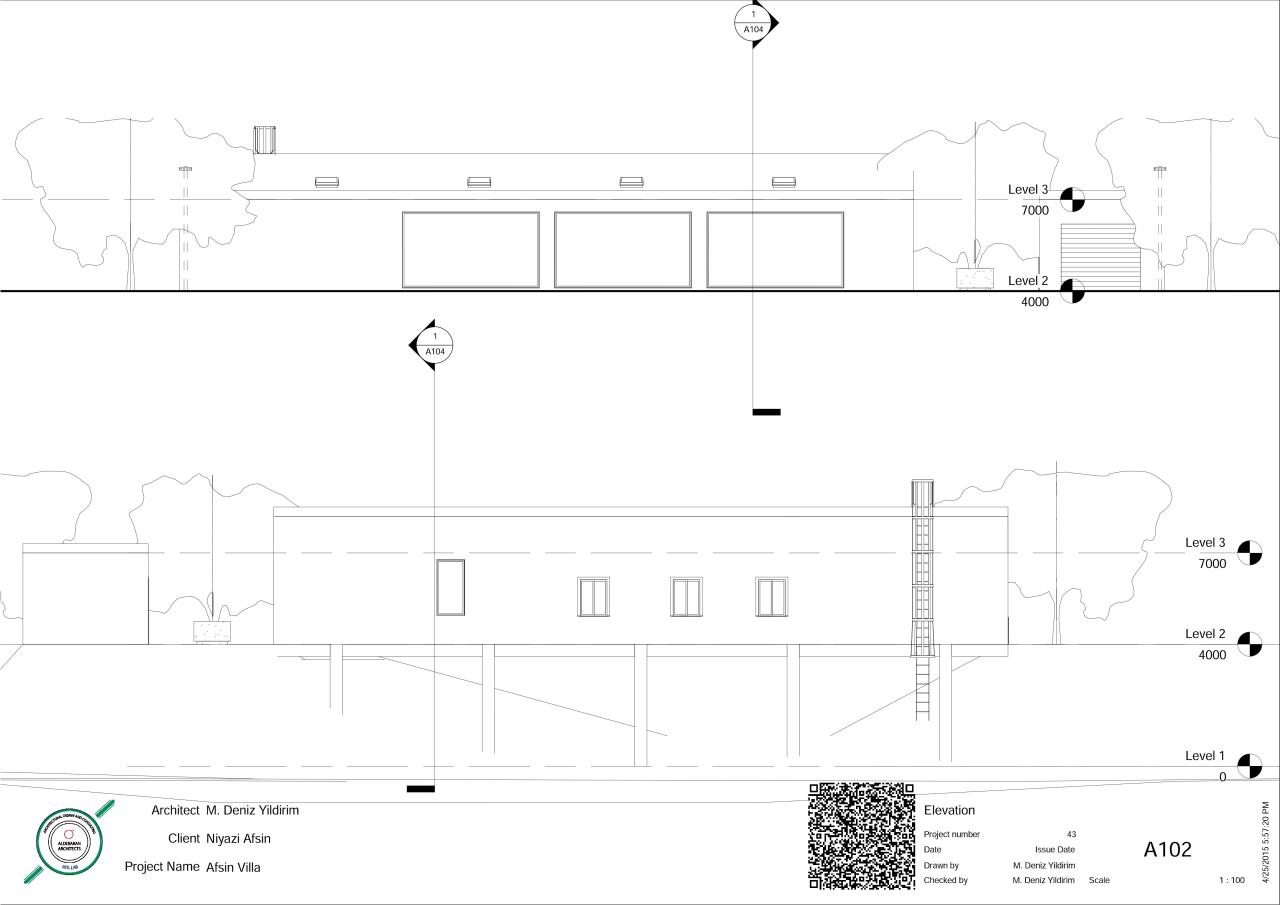
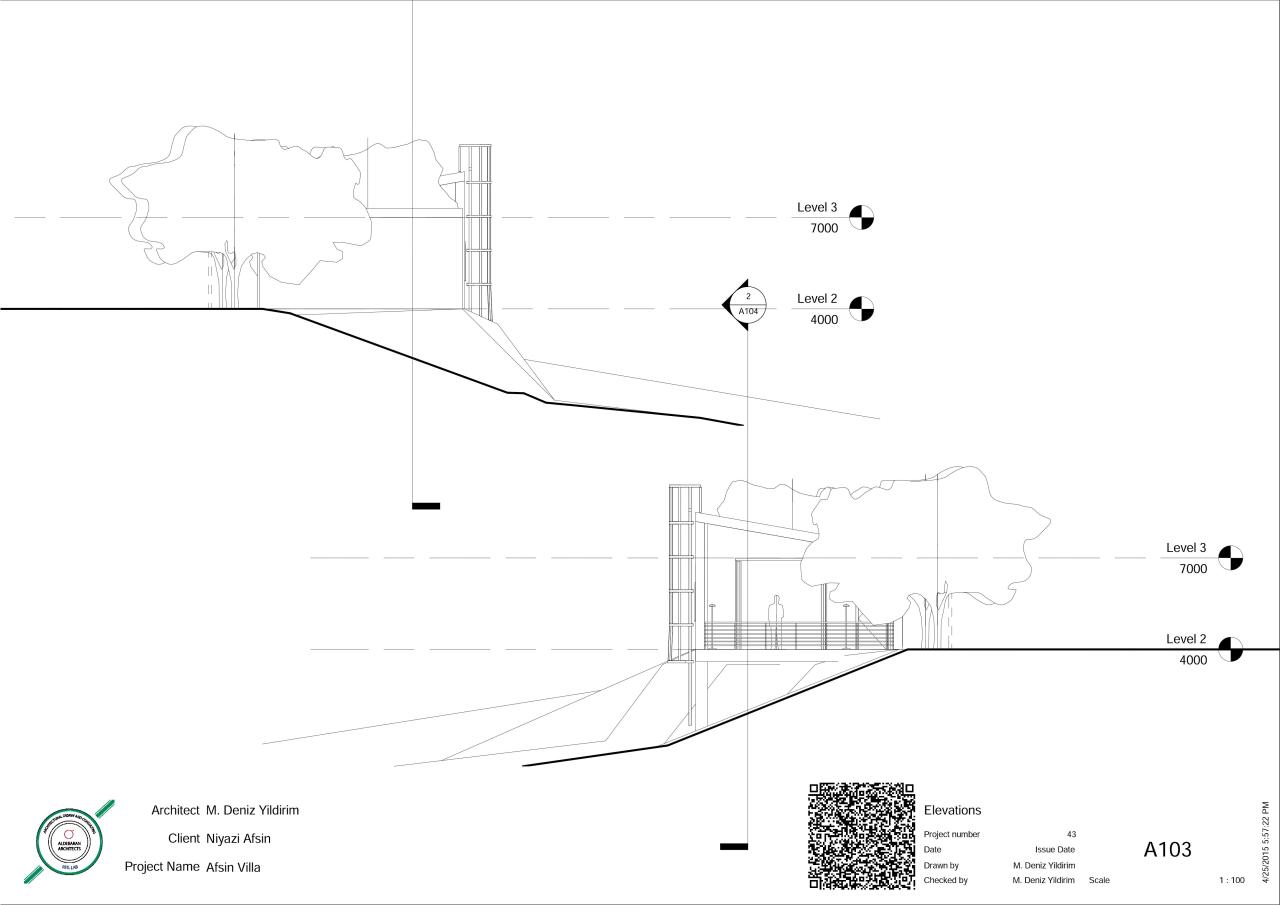
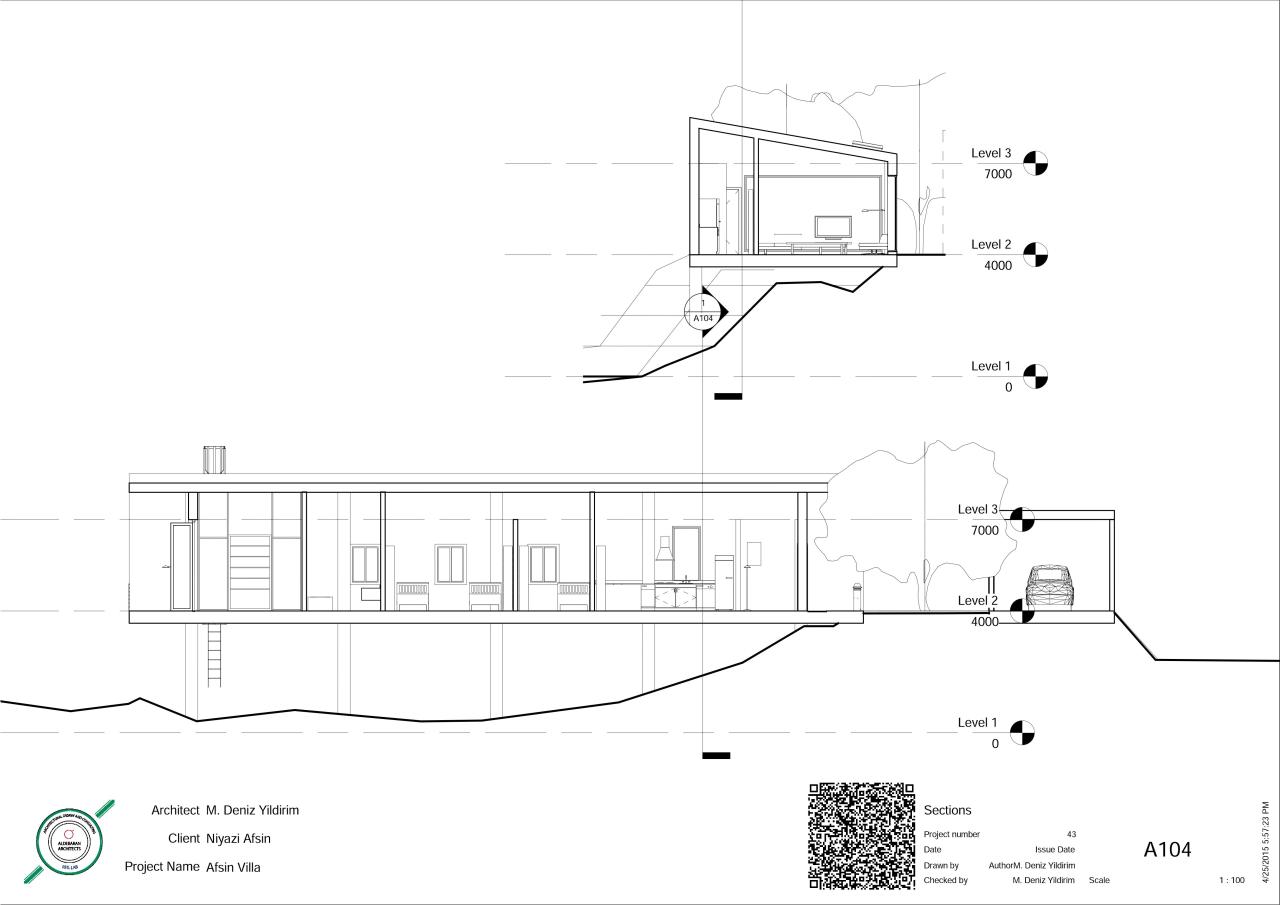
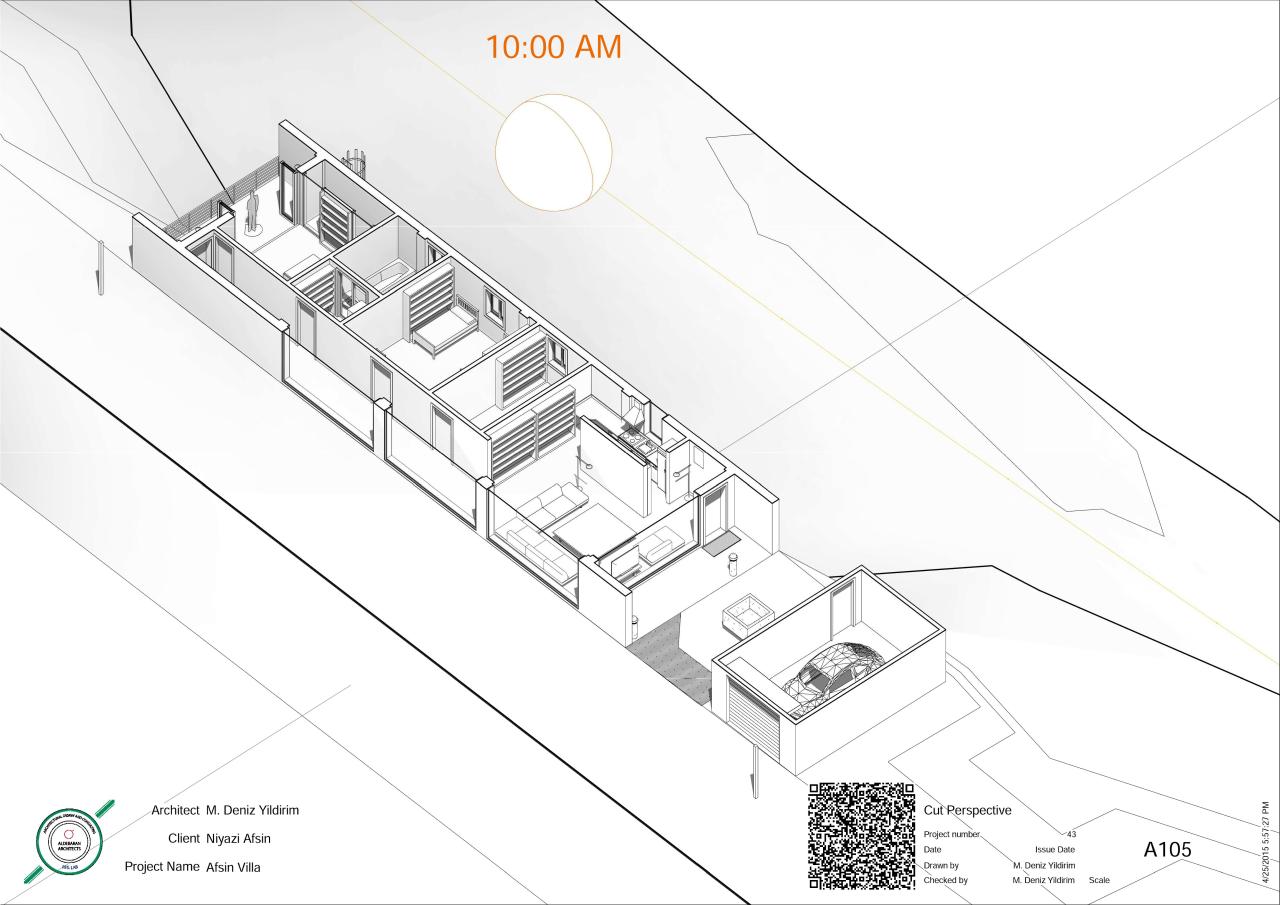
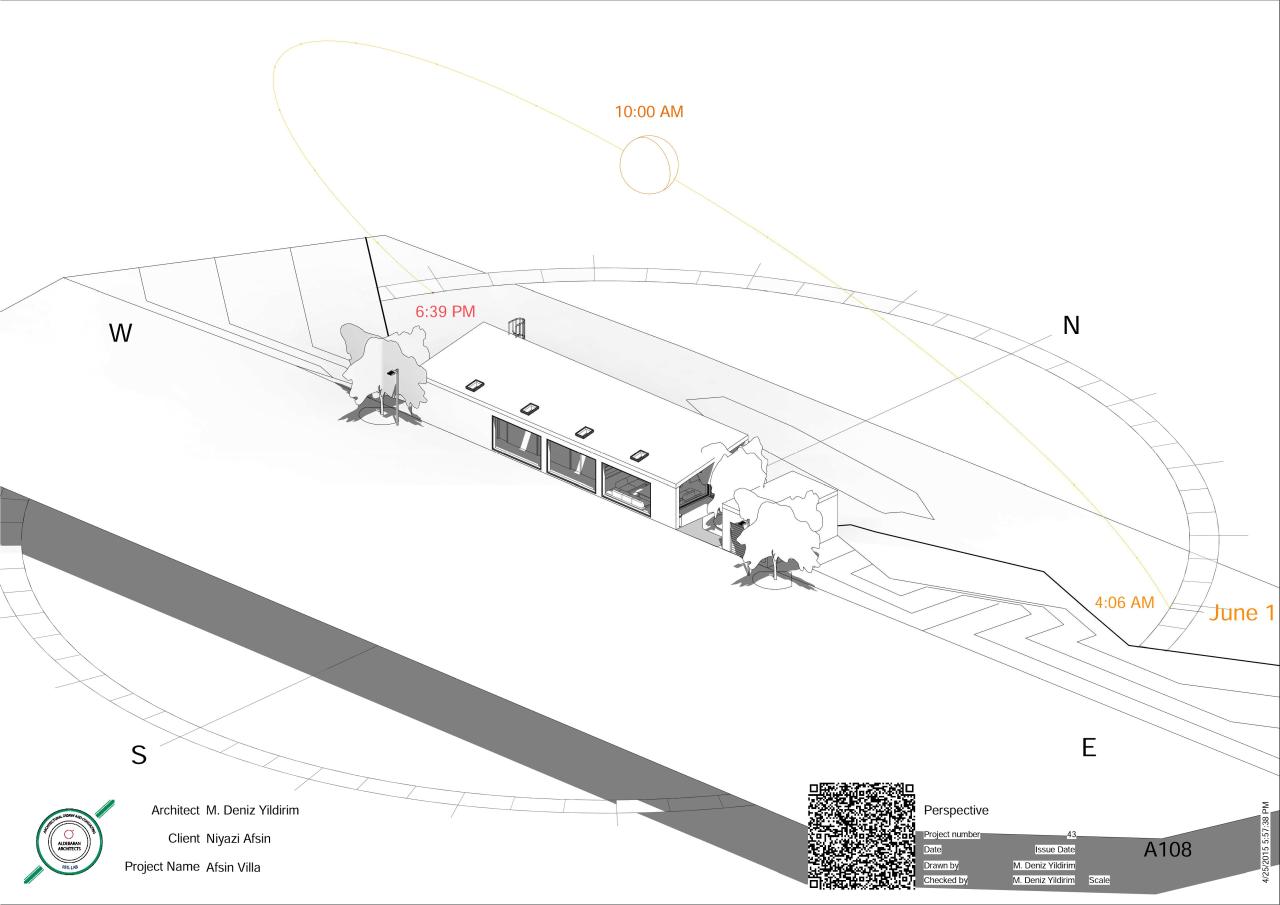
  • Private Villa | Oculus Rift Walkthrough + BIM Model

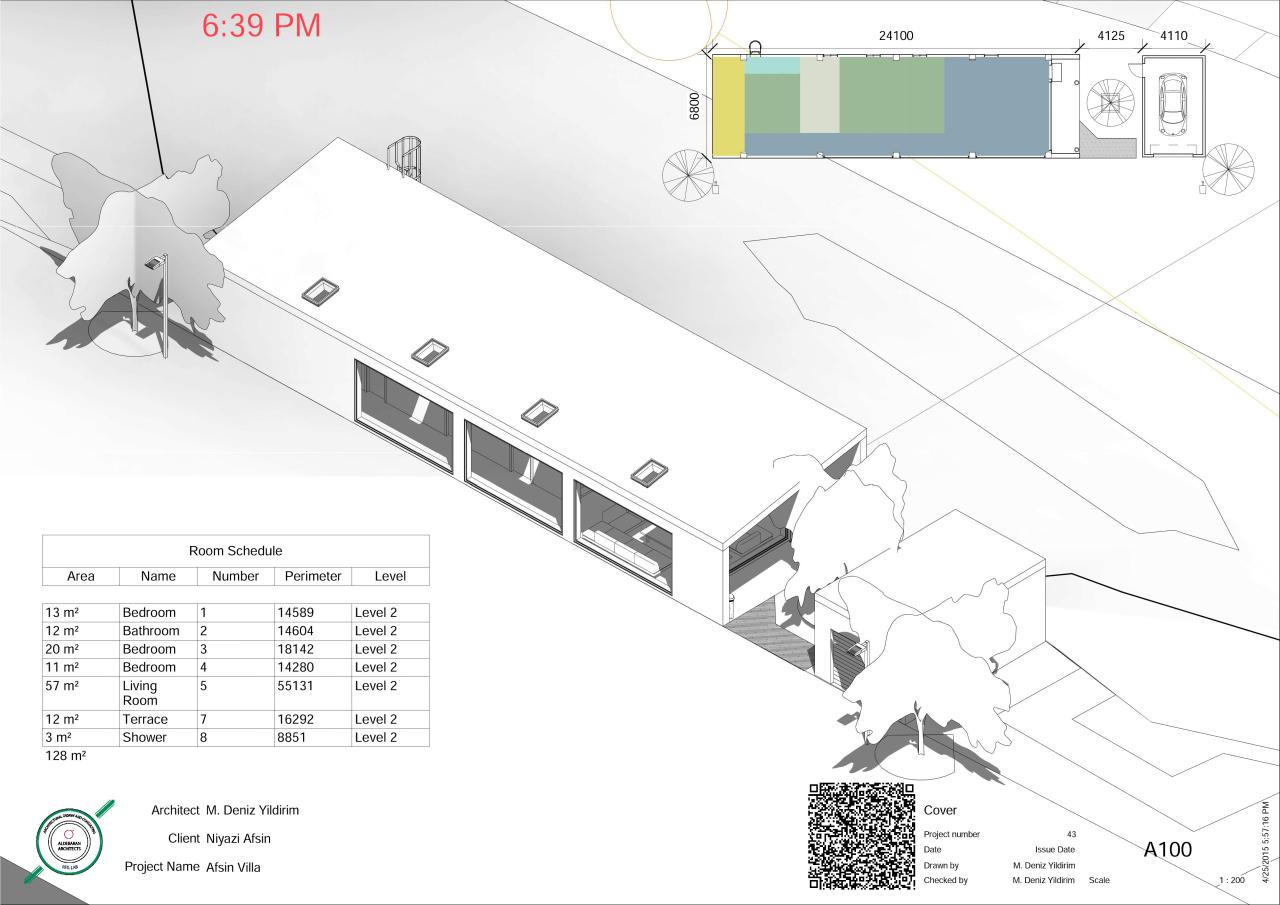
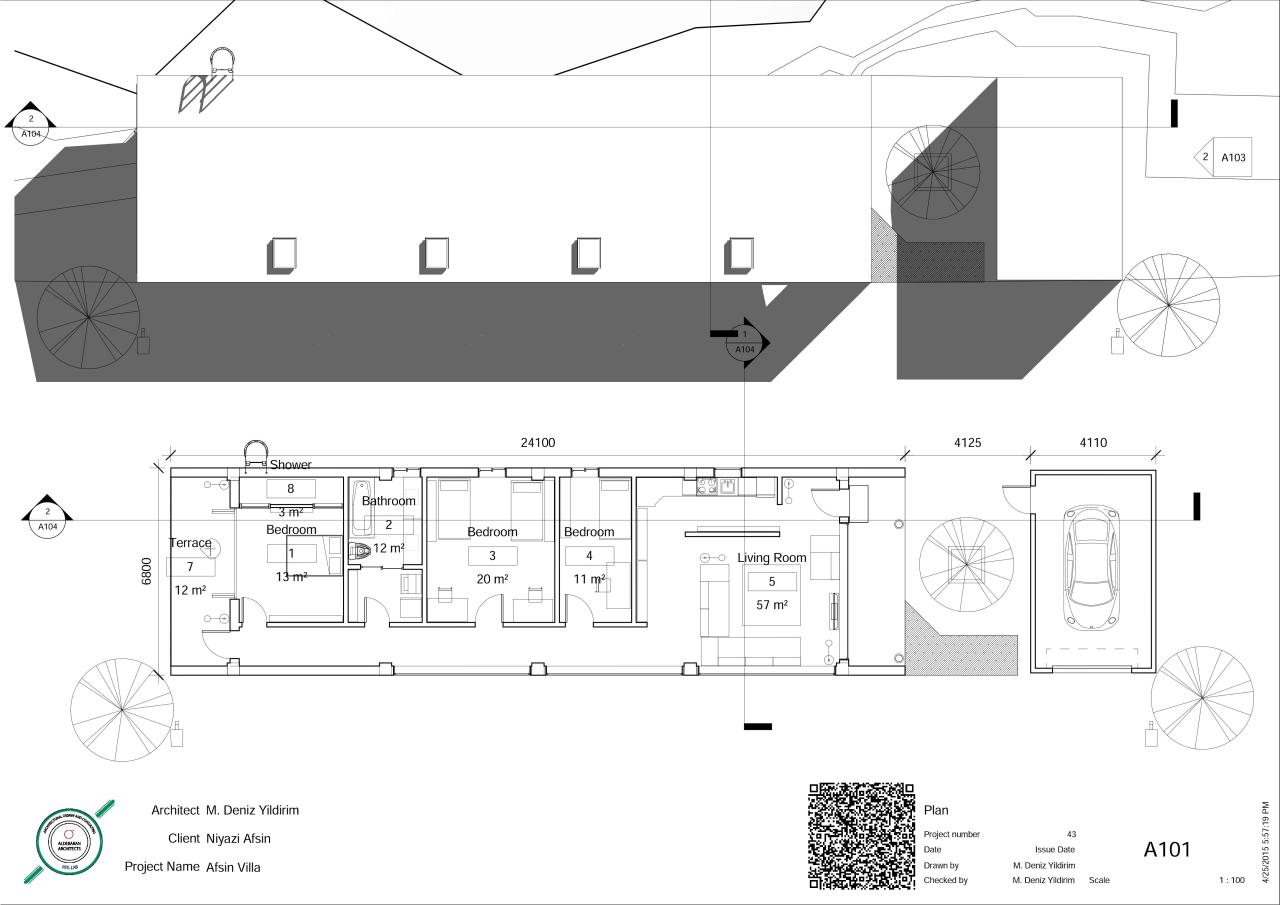
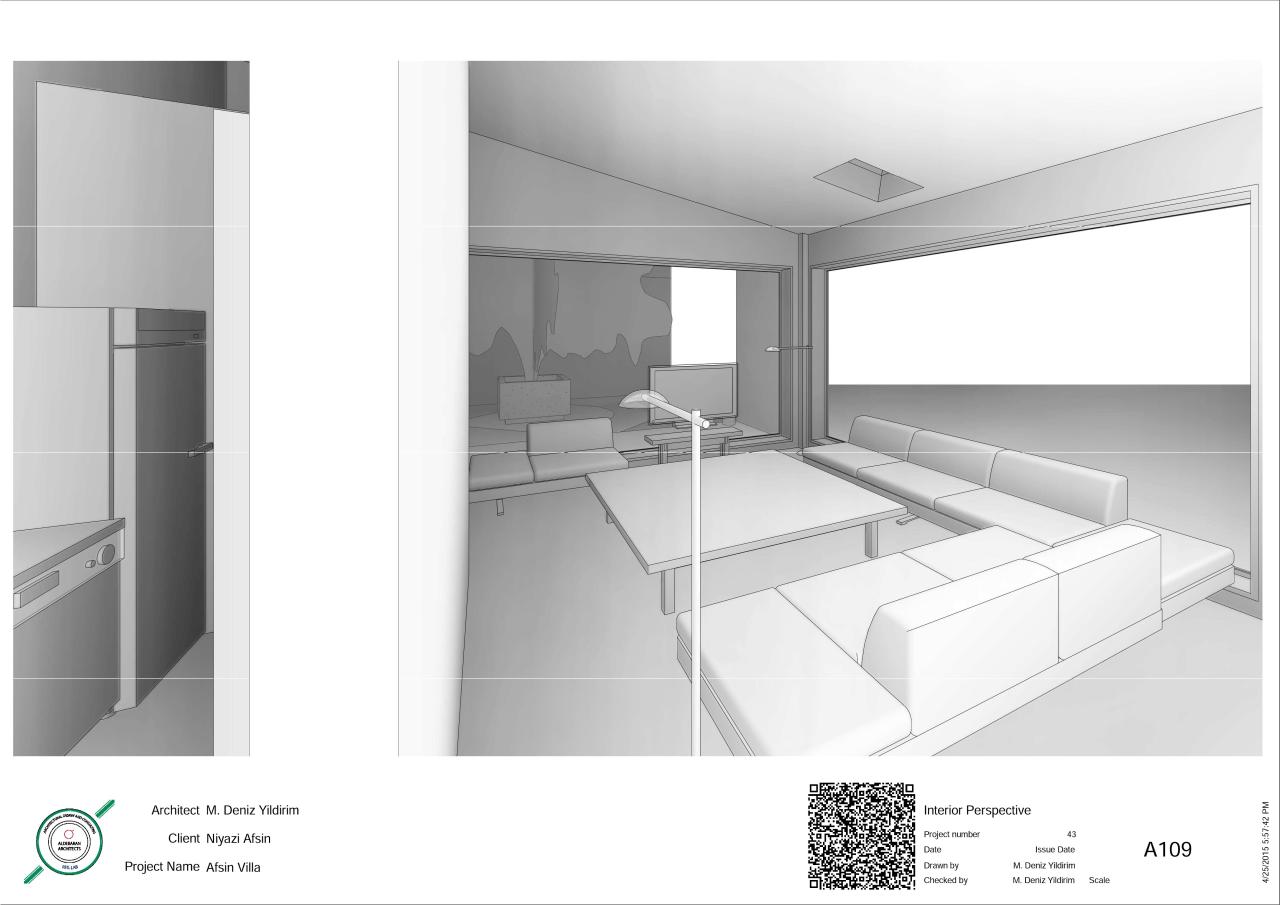
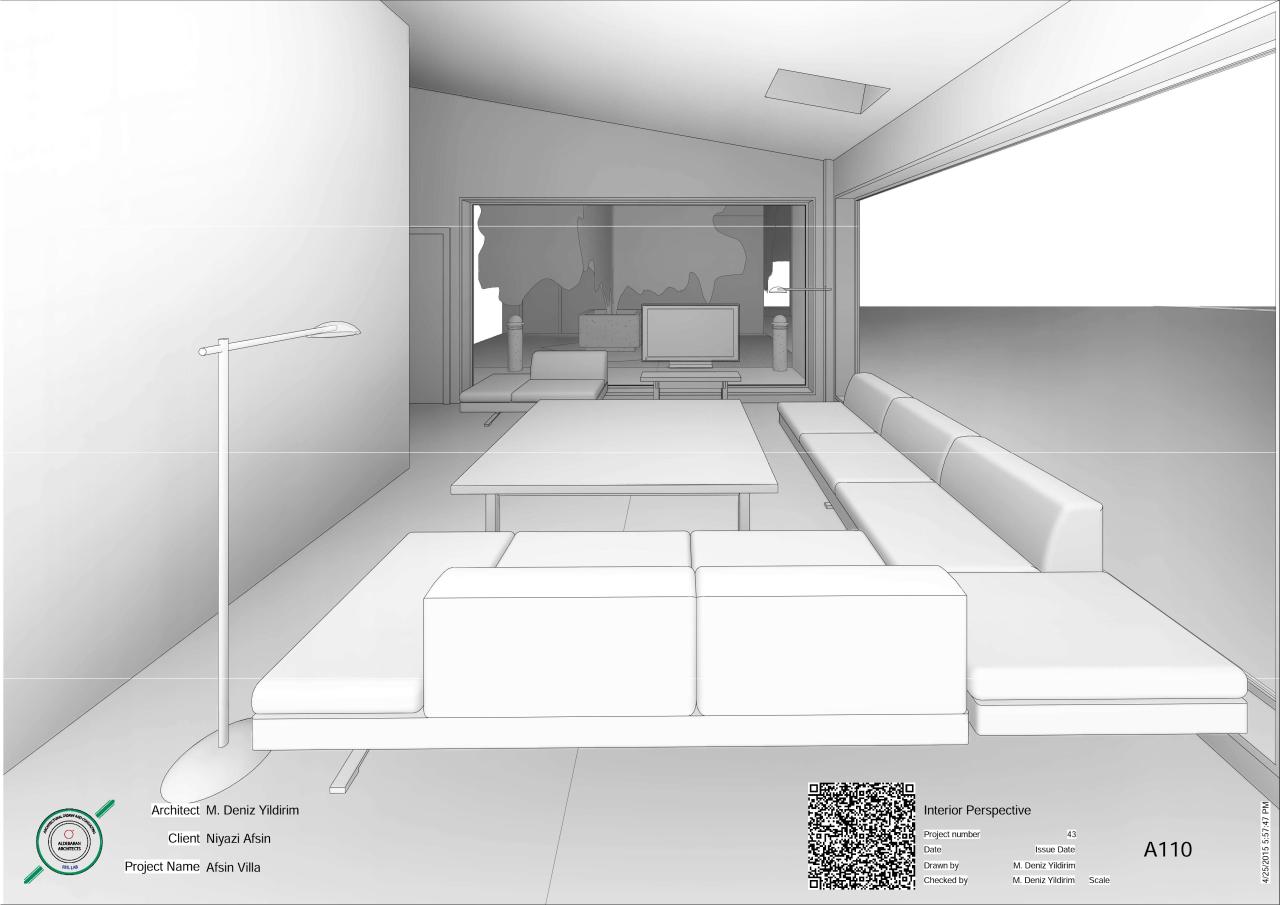
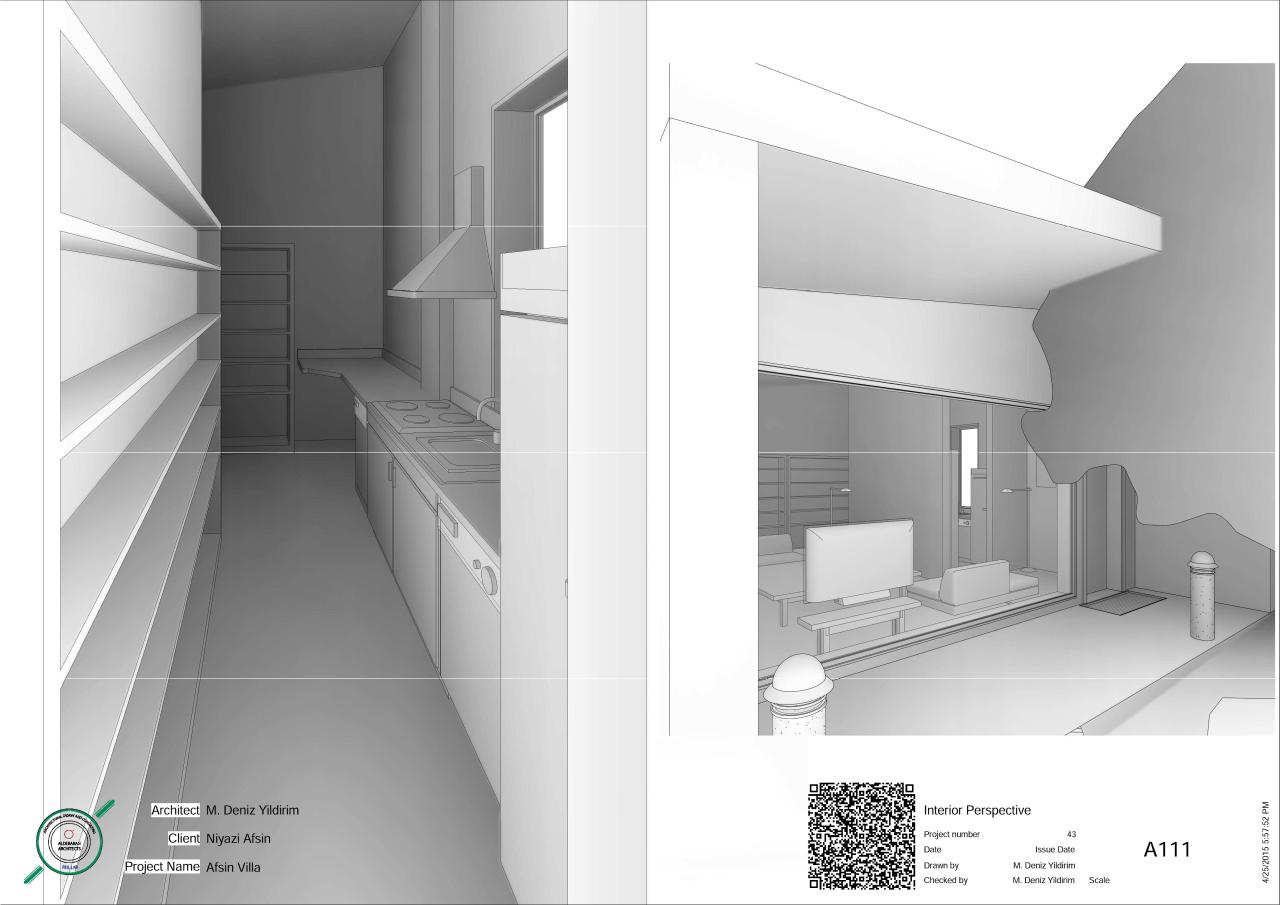
    Videogame walkthrough for a tiny country side project, showcasing a villa design. The game can be accessed through the link provided below, which was also mentioned in my previous post. This standalone game represents the villa project and aims to give the client a clear picture of what the final outcome will look like. Initially, I envisioned using Oculus Rift to achieve a highly immersive visual communication method. However, due to the client being in Turkiye, I opted for developing a standalone game that can be played on their computers. I believe this approach to architectural visualization will become increasingly prevalent in the future.

    The design was tailored to the client’s specifications. The project’s primary goal was to deliver a cost-effective, lean structure that provides a simple shelter with three bedrooms on a farm. Therefore, I aimed to maintain minimalism throughout the design, although features like sky windows, sloped roofs, and large fixed windows were considered luxurious additions to the project.

    The project has potential for various efficiency enhancements, including trombe walls, solar chimneys, and solar panels, all dependent on the client’s budget. Consequently, these features were made optional. Additionally, conducting an energy analysis through Revit could offer insights for optimizing the design to meet ASHRAE standards, reduce carbon footprint, and lower energy needs. This would be a voluntary contribution towards improving the shelter design.

    Also i did a unity game with it’s model to show him the structure. So he will be playing the game of his villa in a few hours. Check the game from here

    So what you need to do is to download the folder named Afsin Villa, then double click then use wasd buttons to navigate. That’s that simple. It seems that it is way much easier to show the client the structure in this way is not it?

    by

  • Oculus Rift / Virtual Reality Tech Demo + Warehouse

    As an enthusiastic virtual reality fan (while being an architect) , i developed some skills from Revit, Rhinoceros modelling programs to Unity Game Engine software to create a virtual reality with gravity, wind, sound, lightning etc. 

    image

    What i achieved is that a tech demo, which you can walk inside with the help of Oculus Rift Dk2 hardware, for specific structures modeled in architectural design software. So with this pipeline, professional projects like a residential villa or a hospital project, can actually be simulated and walked inside for various purposes. 

    image

    These can be a show for the client to further double check what they are gonna get at the end of the project or can be a design tool to be used by the design team to further research and develop the design before proceeding. Therefore team can actually enter inside the structure and they can actually see everything from first person view. 

    This can be generated by Revit or 3ds Max but the problem is that they can give false dept of view, manipulated vision can occur. This type of an experience is more like having a real experience rather than looking to a monitor which has actually two dimension. So that i believe that in near future it will be more likely for architects to use such tools much more efficiently. 

    image

    After the design of the game in Unity, it can be exported to many platforms such as Ios / Android / Web / Oculus Rift etc. I published the fourth version of the tech demo that i have done here in Oculus Share Web Site, so on 26th of March it just got published as in their website. From this link you can reach the game and download it free to have a look. 

    Also there is a donate button on the right side, you’re welcomed to support me by buying me a cup of coffee.

    by